


 By NWV Senior Political News Writer, Jim Kouri
As the cities of Minneapolis, Los Angeles, New York and others across the nation are experiencing the anger, violence and destruction of some Americans who’ve taken to looting businesses, attacking police station houses and torching neighborhood businesses and other structures, U.S. Justice Department and FBI investigators are pursuing the new allegation: That the alleged killing of a black security guard by a white city cop had more to do with workplace violence than with racial bias.
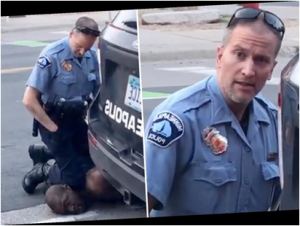
The white Minneapolis police officer, Derek Chauvin, and the black man, the late George Floyd both worked as security guards at a popular Latin nightclub last year.
According to a police officer from the Minneapolis-Saint Paul area, “The now disgraced law enforcement officer moonlighted at a nightspot that had a need for professional security officers to maintain the peace in the club which served liquor and had customers who pedaled marijuana, heroin, cocaine and designer drugs to their fellow patrons.”
 Officer Derek Chauvin became overzealous when the club hosted special events that attracted black customers. The owner claims the cop responded to violence by taking out his police-issued pepper capsicum and spraying not only the people involved in an incident but innocent members of clientele.
“He would [pepper spray] everyone instead of just apprehending and removing the people who were fighting,” said Maya Santamaria, who owned the El Nuevo Rodeo Club [The New Rodeo Club] in Minneapolis.
On Memorial Day, blacks, Latinos and some whites began street marches and protests first in Minneapolis and then in other cities after the apparently out-of-control cop was captured on a witness’ cellphone video as he knelt on the neck and carotid artery of his former co-worker George Floyd for more than eight minutes. During Floyd’s arrest on suspicion of passing a counterfeit bill the four responding police officers including Chauvin failed to find out the nature of the alleged counterfeiting complaint by a store owner.
Floyd died in custody and Chauvin was fired Tuesday and arrested Friday on charges of third-degree murder and manslaughter. The three other officers who took part in the arrest were also fired, and they remain under investigation.
While Chauvin’s off-duty job at the El Nuevo Rodeo club stretched over 17 years until a few months ago, Floyd only started working there recently as a security guard and only worked about a dozen special events.
Workplace Violence
“The workplace is the scene of almost one million violent crimes each year,” claims former Bureau of Justice Statistics director Lawrence Greenfield. “About 10 percent – or 100,000 – of these workplace crimes involve offenders armed with handguns.”
Of the approximately 3.2 million crimes and thefts in the workplace, about 500,000 victims lose an estimated 1.8 million workdays each year and $55 million in lost wages, not including days covered by sick or vacation leave. Among women who experience crime at work, 40 percent are attacked by a stranger, 35 percent by a casual acquaintance, 19 percent by a well-known acquaintance, and one percent by a relative. About 5 percent of workplace attacks on women are perpetrated by a husband, boyfriend, or former boyfriend.
The average number of victimizations totaled over 970,000 (not including homicides): there were 13,068 rapes, 79,200 robberies (17,900 involving injuries), 264,200 aggravated assaults (with over 48,000 serious injuries), and 615,200 simple assaults (89,500 involving injuries).
One study from the National Security Institute indicates that workplace homicides totaled 7,600 in one 10-year period, although the NSI concedes that this figure may be overly conservative because of data gathering limitations. The actual number of occupational homicides may be greater than reported because of the methods used to collect information – mostly death certificates – tend to underestimate the total number of deaths, according to the National Institute for Occupational Safety & Health.
Of the 7,600 homicide victims, 80 percent were male. The homicide rate for male workers is three-times that for women. Nonetheless, homicide was the leading cause of death from occupational injury among women, causing 41 percent of all deaths among women as compared to just 10 percent among men.
Nearly half of the workplace homicides occurred among workers aged 25-44, but workers aged 65 or older had the highest rate of occupational homicide. Additionally, 75 percent of the victims were white, 19 percent were African-American, and 6 percent were Latino or other races. However, the rate for workplace homicide among black workers and other races was more than twice the rate for whites.
As far as weapons of choice, firearms figured in 75 percent of workplace homicides. Knives and other types of cutting and piercing instruments accounted for only 14 percent of these deaths. Information contained on death certificates doesn’t allow identification of the circumstances of homicides in the workplace, but the types of high-risk workplaces and occupations suggest that robbery is the predominant motive.
Some homicides are caused by disgruntled workers and clients, or by domestic violence which may spill into the workplace. An increasing number of these incidents involve one employee killing another over a disagreement. Violent employees have killed co-workers, supervisors and personnel staff in several high-profile cases such as the shooting of several personnel office workers by a former employee at New York City’s Beth Israel Medical Center.
Hate Crimes in America
According to a study released by the National Association of Chiefs of Police, based on figures submitted by 16,149 law enforcement agencies (up from 15,254 agencies in 2016), provide information about the offenses, victims, offenders, and locations of hate crimes.
The reason for the lack of accuracy in the yearly released UCR’s documentation is the fact that it is a voluntary program and as such for whatever reason, local police departments may opt to withhold possession.
Law enforcement agencies submitted incident reports involving 7,175 criminal incidents and 8,437 related offenses as being motivated by bias toward race, ethnicity, ancestry, religion, sexual orientation, disability, gender, and gender identity. Please note the UCR Program does not estimate offenses for the jurisdictions of agencies that do not submit reports.
Highlights of Hate Crime Statistics follow:
Victims of Hate Crime Incidents
- There were 7,106 single-bias incidents involving 8,493 victims. A percent distribution of victims by bias type shows that 59.6 percent of victims were targeted because of the offenders’ race/ethnicity/ancestry bias; 20.6 percent were targeted because of the offenders’ religious bias; 15.8 percent were victimized because of the offenders’ sexual-orientation bias; 1.9 percent were victimized because of the offenders’ disability bias; 1.6 percent were targeted because of the offenders’ gender identity bias; and 0.6 percent were victimized because of the offenders’ gender bias. (Due to rounding, percentage breakdowns may not add to 100.0 percent.)
- Sixty-nine (69) multiple-bias hate crime incidents involved 335 victims.
Offenses by Crime Category
- Of the 5,084 hate crime offenses classified as crimes against persons in 2017, 44.9 percent were for intimidation, 34.3 percent were for simple assault, and 19.5 percent were for aggravated assault. Twenty-three rapes, 15 murders, and one offense of human trafficking—commercial sex acts were reported as hate crimes. The remaining 27 hate crime offenses were reported in the category of other.
- There were 3,115 hate crime offenses classified as crimes against property. The majority of these (74.6 percent) were acts of destruction/damage/vandalism. Robbery, burglary, larceny-theft, motor vehicle theft, arson, and other offenses accounted for the remaining 25.4 percent of crimes against property.
- Two hundred thirty-eight (238) additional offenses were classified as crimes against society. This crime category represents society’s prohibition against engaging in certain types of activity such as gambling, prostitution, and drug violations. These are typically victimless crimes in which property is not the object.
Known Offenders
- In the UCR Program, the term known offender does not imply that the suspect’s identity is known; rather, the term indicates that some aspect of the suspect was identified, thus distinguishing the suspect from an unknown offender. Law enforcement agencies specify the number of offenders and, when possible, the race of the offender or offenders as a group. Beginning in 2013, law enforcement officers may also report whether suspects were juveniles or adults, as well as the suspect’s ethnicity when possible.
- Of the 6,370 known offenders, 50.7 percent were white, and 21.3 percent were black or African-American. Other races accounted for the remaining known offenders: 0.8 percent were American Indian or Alaska Native; 0.7 percent were Asian; less than one-tenth of 1 percent were Native Hawaiian or other Pacific Islander; and 7.5 percent were of a group of multiple races. The race was unknown for 19.1 percent.
- Of the 5,131 known offenders for whom ethnicity was reported, 25.0 percent were not Hispanic or Latino, 8.8 percent were Hispanic or Latino, and 1.6 percent were in a group of multiple ethnicities. Ethnicity was unknown for 64.5 percent of these offenders.
- Of the 4,895 known offenders for whom ages were known, 83.0 percent were 18 years of age or older.
Locations of Hate Crimes
Law enforcement agencies may specify the location of an offense within a hate crime incident as one of 46 location designations. In 2017, most hate crime incidents (27.5 percent) occurred in or near residences/homes. Seventeen (17.0) percent occurred on highways/roads/alleys/streets/sidewalks; 10.5 percent occurred at schools/colleges; 5.8 percent happened at parking/drop lots/garages; and 4.1 percent took place in churches/synagogues/temples/mosques. The location was reported as other/unknown for 11.5 percent of hate crime incidents. The remaining 23.7 percent of hate crime incidents took place at other or multiple locations.
© 2020 NWV – All Rights Reserved
Contact Jim Kouri – E-Mail: COPmagazine@aol.com