How an Exploding U.S. Population Devours the Land that Feeds and Nourishes Us
Very few Americans take note or understand the enormous consequences of exponential growth in America. That growth factor imitates the ceaseless growth of a cancer cell until it overwhelms the host body to kill it. Yes, it kills itself in the process, but the cancer cells don’t care. We continue to invite the same “cancerous growth” via our open borders and legal immigration onslaught.
Have you heard of “ecological footprint” in the context of wilderness, habitat and the other creatures sharing North America with us? Please inspect this quick explanation: an African citizen takes up .4 acres of land, that’s 4/10ths of an acre to feed, house and sustain that person. When an African, Indian or any other immigrant lands in America, that person’s ecological footprint jumps to 25.4 acres to sustain that person. (Source: www.allspecies.org) Why? Because that immigrant’s presence in America multiplies land use by more roads, malls, schools, factories, croplands and housing.
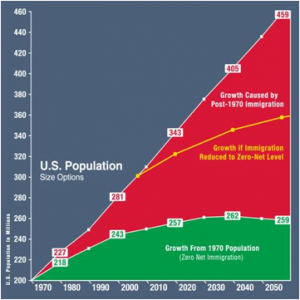
At this moment, America remains on course to add 100,000,000 (million) legal immigrants by 2050, or, 32 years from now. That equates to destroying 2.54 billion acres of wilderness to support that many people. That much animal habitat must be destroyed. Where do the animals go that lose their habitat? They go extinct!
Where does the quality of life in America go? Answer: it piles up in air polluted cities, insane  gridlocked traffic in cities, people stuffed into high rise housing, cities becoming concrete jungles, polluted water, poisoned food and a total loss of connection the natural world.
Roy Beck, director of www.numbersUSA.org, said, “The massive destruction of America’s open spaces continued during the first decade of this new century. In just the eight years from 2002 to 2010, over 8.3 million acres (approximately 13,000 square miles) of farmland and natural habitat succumbed to the bulldozer’s blade. That is an area larger than the entire state of Maryland – cleared, scraped, filled, paved and built over – in less than a decade.”
This update relies on the latest painstaking surveys by government agencies. They have tracked how, since the beginning of the 21st century, America’s population is growing by tens of millions more residents and sprawling over vast new expanses of woodlands, wetlands, fields and pastures. These are the open spaces on which the country’s human residents depend for food, fiber and the nourishment of their spirits, and to which the non-human inhabitants often tenuously cling for life itself.
Sprawl Data and Analysis for Each City
Residents of all 497 of the Urbanized Areas designated by the U.S. Bureau of Census can find in this report answers to the following questions about your home city over the past decade:
- TOTAL SPRAWL: How many square miles of farmland and natural habitat were destroyed as your city expanded outward? Where does that rank among all other cities in open-space loss?
- PER CAPITA SPRAWL: Is the average resident of your city requiring more or less developed land to provide for all residential, commercial, occupational, and educational other urban needs? What was the percentage change? How does the amount of land “consumed” by each resident rank with all other cities?
- POPULATION GROWTH: What is the amount and rate of population growth, and how does that rate rank with all other cities?
- Roughly 85 percent of all destruction of farmland and natural habitat nationwide occurred around the edges of the 497 mostly-sprawling Urbanized Areas. And much of the rest of the losses are due to urban residents’ demands for rural second homes, rural recreation development and rural transportation.
- RATE OF STATEWIDE SPRAWL: What was the percentage rate of open space destruction in each state, and how did that rank with other states?
- STATE POPULATION GROWTH: How much did the populations of each state grow between 1982-2010 and 2002-2010? How did the states compare with each other in terms of overall, absolute population growth and percentage rate of growth in these time periods?
 As you can see from these researched figures, we remain on course to drive our country, our entire civilization over a demographic cliff. What’s amazing, few see it and most don’t give it a second thought. Big business pushes for endless immigration to fill cheap labor jobs by 21st century slaves who invade America whether legally or illegally.
At some point, the average citizen must arm himself or herself with this knowledge and call for a total shutdown of all immigration. If not, once America adds this enormous 100 million more people, problems of water, energy and resources become irreversible and unsolvable.
(Permission to republish this population graph by Roy Beck, www.NumbersUSA.org )
Share these videos all over America:
In a five-minute astoundingly simple yet brilliant video, “Immigration, Poverty, and Gum Balls”, Roy Beck, director of www.numbersusa.ORG, graphically illustrates the impact of overpopulation. Take five minutes to see for yourself:
“Immigration by the numbers—off the chart” by Roy Beck
This 10-minute demonstration shows Americans the results of unending mass immigration on the quality of life and sustainability for future generations: in a few words, “Mind boggling!” www.NumbersUSA.org
© 2018 Frosty Wooldridge – All Rights Reserved
E-Mail Frosty: frostyw@juno.com


